In our last article, The Laws of Diving: Henry, Dalton, Boyle, we explored the basic concepts relating to the physics of diving. In this article, we are going to take a deeper look inside Henry’s Law and see how it relates to tissues and M-Values.
If you’re a Divemaster or Instructor training for your IDC, M-Values are a key concept to master in order to ace your exams. Equally, if you’re simply a diver wishing to gain a deeper insight into the physics side of things, then M-Values are crucial in making clear the processes involved.
Henry’s Law: Recap
Before expanding on Henry’s Law and its implications, let us first revisit exactly what Henry’s Law is:
‘At a constant temperature the amount of gas dissolved in a liquid is directly proportional to the partial pressure of that gas in equilibrium with that liquid.’
Henry’s Law explains why we on-gas, off-gas, and why our bodies are constantly trying to reach saturation.
On-gassing
Simply put, Henry’s Law states that if the partial pressure of a gas in contact with a liquid increases, then the amount of gas molecules dissolved in that liquid will increase proportionately. Therefore, the partial pressure of the gas will always be equal to the partial pressure of dissolved gas in the liquid.
Let’s say we dive to 10 metres. At 10 metres, the ambient pressure in 2 bar (double that of surface pressure).
This means that the gas we breathe at 10 metres will thus be twice as dense as what we breathe on the surface (to compensate for the doubling of ambient pressure). Increased density means an increase (doubling) in the total amount of nitrogen molecules per inhaled breath in the gas we breathe.
As our tissues are normally saturated at surface pressure (1 bar), this means that the partial pressure of inhaled gas in our blood stream at 10 metres will be higher than that of the dissolved gas in our tissues.
Therefore, as gas molecules move from areas of high concentration to low concentration, nitrogen molecules will move out of our bloodstream into our tissues.
This will continue until the partial pressure of nitrogen dissolved in our tissues is equal to that of the partial pressure of nitrogen in our bloodstream (inspired gas). At this point, our body will have again reached saturation, this time at 2 bar. This process is illustrated below, and is what we call ‘on-gassing’:
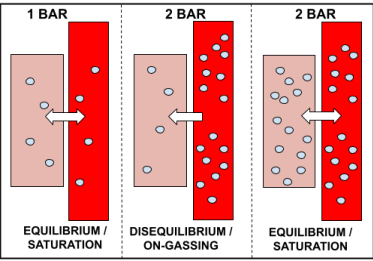
‘On-gassing’ is simply the process of inert gas (nitrogen) moving into our tissues. This happens every time we go diving, no matter the depth, and occurs specifically on the descent and bottom phase of the dive.
On-gassing occurs because our body is constantly trying to achieve a state of equilibrium with the ambient pressure. Therefore, in the example above where the diver dives to 10 metres (2 bar), inspired gas moves from high concentration in the bloodstream, to the less concentrated area in the tissues, and continues to do so until the concentrations are equal to one another (i.e. until the partial pressures are the same).
Off-gassing
Now, everything in life has an opposite, including on-gassing. The opposite of on-gassing is known as ‘off-gassing.’
Off-gassing occurs when the partial pressure of dissolved gas in our tissues is greater than the partial pressure of the inspired gas.
When would this happen? you may ask.
This occurs on the ascent portion of the dive, when the ambient pressure is gradually decreasing. Again, this happens every time we go diving.
Off-gassing is the process of inert gas (nitrogen) leaving our tissues, and entering our bloodstream to be removed from our body by exhalation. This is demonstrated in the diagram below.
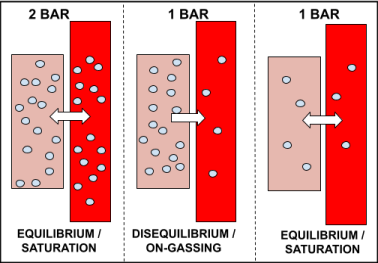
In the example above, the diver ascends from 10 metres (2 bar) back to the surface (1 bar), after having stayed long enough at 10 metres to become saturated.
Upon reaching the surface, the partial pressure of dissolved gas in the tissues is greater than the inspired gas pressure, as the ambient pressure has now decreased from 2 bar to 1 bar.
Therefore, dissolved gas begins to move out of the tissue, to lower concentrated areas, in an attempt to reach saturation. After having stayed on the surface long enough, the tissues eventually become saturated to 1 bar.
Tissues
Now that we have established the basics of on-gassing, off-gassing and saturation, we can now delve deeper into tissues and M-Values.
Tissue Variation
In the world of dive physics and dive medicine, we often speak about our ‘tissues’ and how diving affects them. Yet, what exactly do we mean by this elusive term?
When we dive, it is our body’s tissues that absorb and store inert gas (e.g. nitrogen), in an attempt to re-saturate with the higher ambient pressure. Similarly, when we ascend and return to the surface, our tissues release this inert gas, again in an attempt to re-saturate with the ambient pressure at surface level.
However, there are two factors which affect how our tissues do this:
1. Our body is perfused (supplied with blood) to varying degrees. For example, the brain – despite accounting for less than 2% of our total body weight – is one of the most highly perfused organs in our body. Therefore, not all tissues will be supplied with blood at the same rate and will thus on/off-gas at differing rates.
2. Similarly, because our tissues vary in composition, they absorb and release gas molecules at different rates.
What does this mean for us?
This means that no two tissues in our body are the same. Each tissue absorbs and releases gas molecules at differing rates and is perfused to varying degrees.
This matters for us as divers as we need to know how fast our tissues absorb and release gas molecules in order to know what our NDL is and how much decompression we have in the event we break our NDL.
Over the last century, hyperbaric scientists have attempted to calculate exactly what these differing rates are.
The rates of absorption and release are referred to as half-times.
Half-Times
The concept of ‘half-time’ simply refers to the amount of time it takes a substance to reach half of its maximum value.
In diving, we talk about the half-times of tissues or ‘tissue compartments.’ Simply, the half-time of a tissue is the amount of time it takes the tissue to become half-saturated with inert gas.
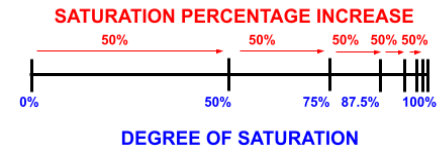
For example, a tissue with a half-time of 2 minutes will take 2 minutes to become half-saturated. After the first two minutes, it will take another 2 minutes for the tissue to move halfway between 50% and 100%: so it will become 75% saturated after a total of 4 minutes. This progression is demonstrated in the table below:
| Time(minutes) | Tissue Saturation(percentage) |
| 2 | 50 |
| 4 | 75 |
| 6 | 87.5 |
| 8 | 93.75 |
| 10 | 96.88 |
| 12 | 98.44 |
As observable, it is mathematically impossible for the tissue to ever reach 100% saturation using this model. However, for simplicity’s sake, we consider it to be fully saturated after six half-times (98.44%).
Fast, Medium & Slow Tissues
Coming back to our original point, tissues on and off-gas at varying rates. This is because tissues have different half-times.
Over the course of the last century, tissues have been divided into three categories in order to create accurate decompression algorithms. These categories are: fast, medium and slow tissues. This is based on their half-time.
The shorter the half-time, the faster the tissue.
Fast tissues have half-times such as 5 minutes. Upon the diver descending underwater, these tissues on-gas the quickest and will be the first to become fully saturated.
Fast tissues are responsible for our short NDL times as they on-gas the quickest.
However, when we begin ascending, fast tissues are also the first and quickest to off-gas/desaturate.
Slow tissues, on the other hand, have half-times in excess of 120 minutes. These tissues are the slowest to on-gas.
However, when we ascend, slow tissues are the last to off-gas/desaturate. Thus, the slow tissues are responsible for long decompression times in the shallows. The graph below demonstrates the different tissue half times in relation to saturation rates.
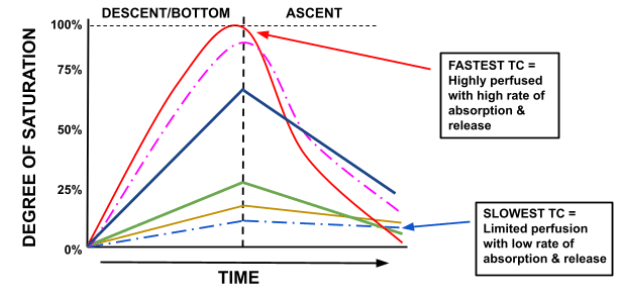
The fastest tissue compartment (TC) is first to fully saturate and first to fully desaturate, and vice versa for the slowest TC.
Figure 4 shows that, at the end of the dive, the fastest tissue is fully desaturated while the slow and medium tissues are still off-gassing.
How Many Tissues?
Hyperbaric scientist John Haldane, when designing his decompression algorithm for the navy, suggested that the human body should be modelled using five different tissues, with half-times of 5, 10, 15, 20, 40 and 75 minutes. This, he thought, would accurately represent tissue variation in the human body.
Later, a sixth tissue was added, with a half-time of 120 minutes.
Years later, hyperbaric scientist Robert Workman then revised this to a total of nine tissues, increasing the amount of slow tissues, with a maximum half-time of 240 minutes.
Lastly, the infamous scientist Albert A. Buhlmann further revised this to a total of sixteen compartments, used in the popular ZHL-16 decompression algorithm of today.
Ultimately, we cannot accurately model the various tissues of the body as they are subject to too many physiological variables, and also differ from individual to individual.
However, the approximations of tissues used by the decompression models of today are sufficient in serving as general models that, all things remaining equal, work for everybody. But it is useful to remember that when we talk of ‘tissues’ we are not implying that the models represent the body’s tissues with exact accuracy.
M-Values
Now that we have established what is meant by tissues and how they are governed by half-times, we can now turn to M-Values: the unjustly dreaded subject of dive theory.
The phrase ‘M-Value,’ coined by Robert Workman, stands for ‘Maximum Value.’ The M-Value is simply the maximum level of supersaturation a tissue can sustain without developing decompression sickness.
Let’s break this down.
As previously established, supersaturation occurs when we ascend; i.e. when the partial pressure of dissolved inert gas in our tissues is greater than the partial pressure of inert gas inspired. This leads to inert gas molecules leaving the tissue in an attempt to saturate to the given ambient pressure (i.e. reach equilibrium).
Thus, when we are supersaturated we are off-gassing. This is a good thing, as we want to off-gas to allow our body to re-saturate to the new ambient pressure.
However, too much supersaturation is a bad thing. This is known as critical supersaturation.
As the definition implies, there are different levels of off-gassing; in other words, we can off-gas at different rates (i.e. faster or slower).
Off-gassing is controlled by the difference between dissolved inert gas pressure (‘tissue tension’) and the ambient pressure.
The greater the difference, the higher (faster) the rate of off-gassing.
EXAMPLE:
Let’s say you dive to 40 metres and stay there until you incur some decompression time. If you were to then ascend to 30 metres for the first decompression stop, you would begin off-gassing, albeit at a slow/gentle rate.
However, if you were to ascend directly to 5 metres, the off-gassing rate would be much higher, as the change in ambient pressure is greater and thus the difference between tissue tension and ambient pressure is much greater.
But, as you learned in your open water course, ascending too quickly/to a depth that is too shallow can result in bubble formation and decompression sickness. In other words, we are at risk when we exceed critical supersaturation levels.
Thus, effectively, the M-Value tells us where the safe maximum level we can ascend to is, without developing bubbles and decompression sickness.
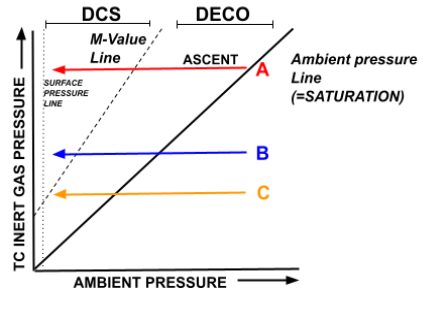
There is a specific graph used to illustrate M-Values, as shown and explained below.
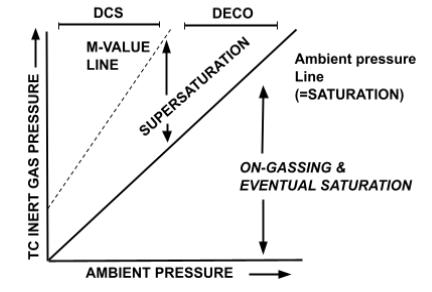
- The area between the ‘Ambient Pressure Line’ and the ‘M-Value Line’ demonstrates allowable (safe) supersaturation levels.
- When we begin to ascend from a dive, we are in the ‘Supersaturation’ zone.
- If we ascend too quickly, we exceed the M-Value Line, i.e. moving to the left of it, and risk entering the ‘DCS’ (Decompression Sickness) zone.
- Below the Ambient Pressure Line represents the portion of the dive in which we are on-gassing and have yet to saturate.
Now that you understand the basic format of the graph, now we can take it another step further. The diagram below is the M-Value graph with a dive profile on it.
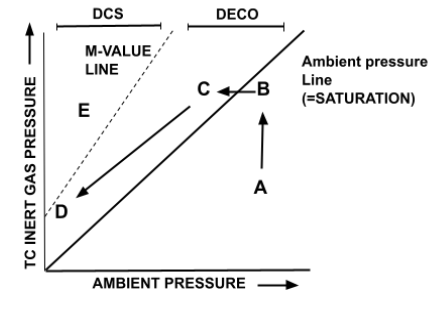
- Point A represents the beginning of the dive, during the descent and bottom time. The ambient pressure is greater than the pressure of dissolved inert gas in our tissues, and thus the body begins on-gassing, moving from point A to point B (an increase in dissolved inert gas pressure).
- Point B represents saturation. The tissues have reached equilibrium with the ambient pressure, and are now neither on nor off-gassing.
- Point C represents the initial ascent portion of the dive, when the tissues are supersaturated. The inert gas dissolved in the tissues is at a higher pressure than the ambient pressure, and thus begins off-gassing. This is the phenomenon of decompression. This will shift the graph from point C to point D as with each decompression stop the ambient pressure is being reduced and with each stop inert gas is being released from the tissues, thereby resulting in a leftward-diagonal movement.
- By Point D our tissues are close to surface pressure again and we are ready to exit the water safely, without exceeding our M-Value.
As a thought experiment, to allow you to better understand the graph, Figure 7 below demonstrates what it would look like to exceed the M-Value Line.
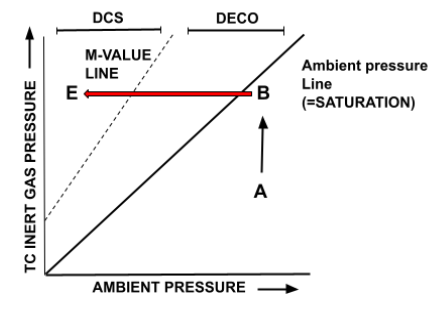
- If the diver at point B (saturated and at the deepest depth of the given dive) was to ascend to a very shallow depth (Point E), they would move out of the ‘Deco’/safe supersaturation zone into the ‘DCS’ zone, as the supersaturation (off-gassing rate) is too high (in excess of critical supersaturation).
- This would result in bubble formation and decompression sickness.
Multiple Tissue Compartments
So far we have established how supersaturation and off-gassing rates vary and how they relate to the M-Value. However, the graph we have been using assumes that all the tissues in our body are the same.
In reality, as previously explained, tissues vary in their off-gassing rates based on their half-times, and are categorised into fast, medium and slow ‘tissue compartments.’
Therefore, on a given dive, the graph would actually look more like the one below.
- The aligned points of A, B and C represent the point at which the diver will begin to ascend on a given dive. In other words, when the diver ascends, these three different tissues will be at differing levels of saturation, and will thus be differently supersaturated when the ascent begins.
- On the first part of the ascent, we can see that Line A, the fastest tissue, is immediately supersaturated and thus begins off-gassing immediately.
- Lines B & C, however, do not immediately reach supersaturation on ascent. This is because they on-gas at a slower rate, and therefore, must wait to reach a lower ambient pressure before they can begin off-gassing. Consequently, they continue to on-gas while tissue A off-gases. This can be seen by the increasing gradient of Lines B & C comparative to the decreasing gradient of Line A.
- On the first decompression stop (where the three lines become vertical) it can be seen that Line C is still continuing to on-gas at this depth. It is only towards the end (i.e. in the shallows) that tissues B & C begin to off-gas.
Leading Tissue Compartments
Lastly, following on from this idea of multiple tissue compartments off-gassing at different rates, we turn to the idea of the ‘leading/controlling tissue compartment.’
As established, tissue compartments are categorised as fast, medium and slow. This is based on their halftime value. The shorter the halftime, the faster the tissue (the tissue with a 5 min halftime is faster than the tissue with a 240 minute halftime).
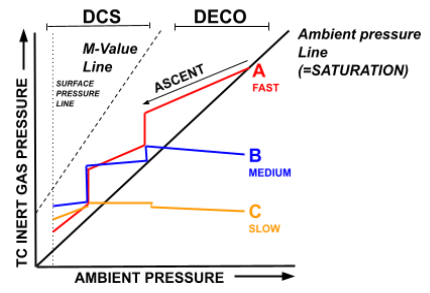
In general, it can be said that the fast tissues ‘control’ the deeper portion of the dive while the slow tissues ‘control’ the shallow portion. The diagram below makes this clearer.
- The purpose of this is to demonstrate that fast tissues control the deep ascent while slow tissues control the shallow ascent.
- Line A is a fast tissue (having already reached saturation), while B and C are medium and slow tissues, respectively.
- The fast tissue is first to arrive at its M-Value during the ascent, with the medium and slow coming far after.mThis is because Tissue A is already saturated and is thus immediately in a state of supersaturation upon ascent.
- Thus, it can be said that the fast tissue compartment is the ‘controlling compartment’ in the deep portion of the ascent, as it determines where the first decompression stop will be (as a result of its M-Value). In other words, it is unsafe to go shallower because of the fast tissues M-Value.
- Comparatively, Tissue B is still on-gassing/unsaturated during the initial ascent (it is to the right of the Ambient Pressure Line). Therefore, it is not ‘leading’ the decompression schedule as it has not yet reached supersaturation and is thus nowhere near its M-Value.
- In the shallow portion of the ascent, however, specifically around the last decompression stop, it is the slow tissues that are now controlling the dive profile. This is because at this point the fast tissues have already desaturated to a point at which surfacing is possible without exceeding their M-Values.
- The slow tissues, however, were the last to begin off-gassing, and as they off-gas at the slowest rate they will take the longest to reach the point at which surfacing is possible.
- Therefore, slow tissues control/lead the shallow portion of the dive.
Concluding Thoughts
Obviously, the concept of M-Values is a lot to take in at first, and will require you to go back through to remind yourself of the starting premises. However, with its step by step approach, hopefully this article has made the learning process one step simpler.
If you’ve enjoyed learning about tissues and M-Values, then stay up to date with our Education series so that you can learn more about the latest dive theory. Next read is on Decompression Sickness – The Symptoms and Classification.